Technical Analysis & Liquidity Mapping
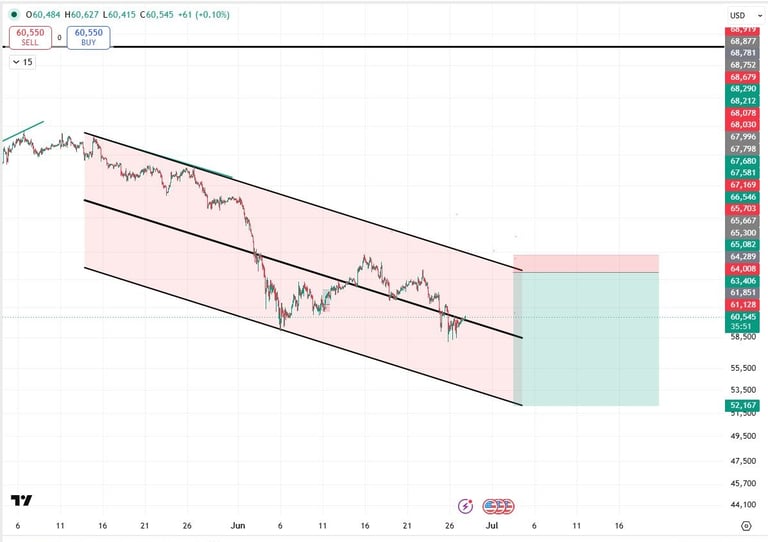
BTCUSD Technical Analysis (1H Chart)
Chart Pattern: Descending Parallel Channel 📉
Current Price: 60,545 USD
Bitcoin continues to trade inside a well-defined descending channel, indicating that the broader trend remains bearish. Price has recently bounced from the lower half of the channel and is now testing the channel's midline resistance.
Market Structure
Trend: Bearish
Momentum: Weak recovery within a downtrend.
Bias: Neutral-to-Bearish until a confirmed breakout above the channel.
Key Technical Levels
Resistance
61,800 – 62,000 USD: Immediate resistance.
63,400 – 64,100 USD: Strong resistance and potential profit-taking zone.
Upper Channel Resistance (~64,300 USD): A breakout above this level could signal a trend reversal.
Support
59,000 USD: First support.
57,500 USD: Major support inside the channel.
52,000 USD: Strong long-term support if bearish momentum accelerates.
Trading Outlook
🟢 Bullish Scenario
If Bitcoin breaks and closes above the upper channel trendline with strong buying volume:
Target 1: 61,800 USD
Target 2: 63,400 USD
Target 3: 64,100 USD
A successful breakout would invalidate the current bearish channel and may start a short-term bullish trend.
🔴 Bearish Scenario
If price fails to break the midline resistance and gets rejected:
First downside target: 59,000 USD
Second target: 57,500 USD
Final bearish target: 52,000 USD
This would confirm that sellers remain in control and the descending channel is still intact.
Risk-to-Reward Setup (Based on Your Chart)
Entry: Around 60,500 USD
Stop Loss: 64,100 USD
Target: 52,000 USD
Risk/Reward: Approximately 1:2.3, favoring the downside if resistance holds.
Conclusion
Bitcoin remains in a bearish descending channel, with the current move appearing to be a relief bounce rather than a confirmed trend reversal. Traders should watch for a decisive move:
Above 64,100 USD for a bullish breakout.
Below 59,000 USD for continuation of the bearish trend toward 52,000 USD.
Disclaimer: This analysis is for educational purposes only and should not be considered financial or investment advice. Always use proper risk management and confirm trade setups with volume and other technical indicators before entering any position.